Configuration
Percona Cloud Tools (PCT) provides a number of advanced configuration options. To access PCT configuration, open the Configure section of the web UI.
The Configure section enables you to manage the following:
- Server instances
- MySQL instances
- Percona Agents
- Email reports
Server Configuration
The Server tab contains information about all server instances known to PCT. For each server, you can open System Info with a detailed report.
To configure how general server metrics are collected,
click Server Metrics for a specific server.
General server metrics include CPU, memory, disk,
and other critical system readings that are not related to MySQL.
These metrics are collected from the proc filesystem,
commonly mounted at /proc.
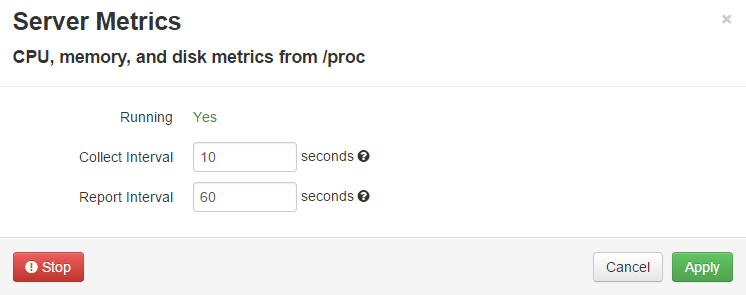
The Server Metrics dialog enables you to:
- See the status of Percona Agent on the server (running or not)
- Stop the percona-agent service on the server
- Configure how often Percona Agent should collect and report collected server metrics
When you configure necessary settings, click Apply to save changes.
MySQL Configuration
The MySQL tab contains information about all MySQL instances known to PCT. For each MySQL instance, you can open the System Info with detailed report.
Configuring Metrics Monitor
To configure how MySQL metrics are collected, click MySQL Metrics for a specific MySQL instance. MySQL metrics are used to populate charts for Metrics Monitor.
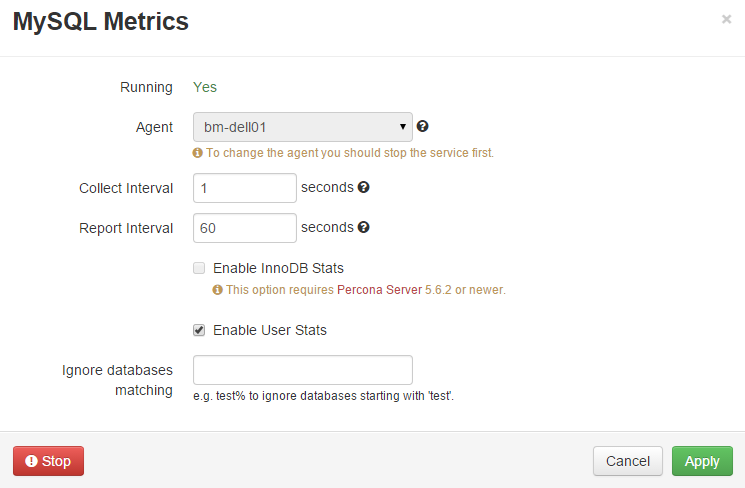
The MySQL Metrics dialog enables you to:
- See the status of Percona Agent on the server (running or not)
- Stop the percona-agent service on the server
- Select a local or remote agent used for this MySQL instance (you have to stop the percona-agent service)
- Configure how often Percona Agent should collect and report collected MySQL metrics
- Enable InnoDB metrics if you are running Percona Server (for more information, see https://www.percona.com/doc/percona-server/5.5/diagnostics/innodb_stats.html)
- Enable additional user statistics if you are running Percona Server (for more information, see https://www.percona.com/doc/percona-server/5.5/diagnostics/user_stats.html)
- Ignore certain databases when collecting user statistics (see previous point)
When you configure necessary settings, click Apply to save changes.
Reporting MySQL Configuration
To configure how MySQL configuration is collected,
click MySQL Configuration.
MySQL uses configuration files to store operating parameters.
Percona Agent collects MySQL running configuration
from SHOW GLOBAL VARIABLES and reports it every hour by default.
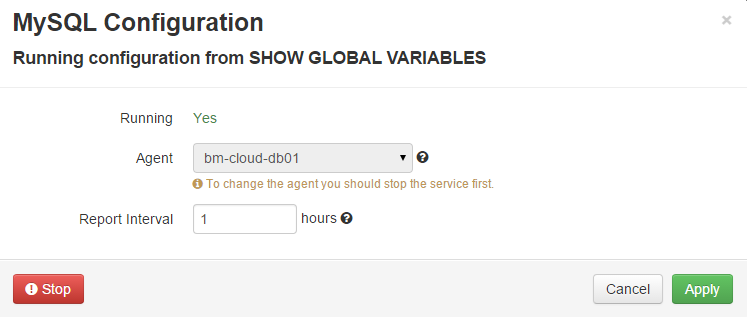
The MySQL Configuration dialog enables you to:
- See the status of Percona Agent on the server (running or not)
- Stop the percona-agent service on the server
- Select a local or remote agent used for this MySQL instance (you have to stop the percona-agent service)
- Configure how often Percona Agent should report MySQL configuration
When you configure necessary settings, click Apply to save changes.
Configuring Query Analytics
To configure how query data is collected, click Query Analytics for a specific MySQL instance. Query data is used by Query Analytics.
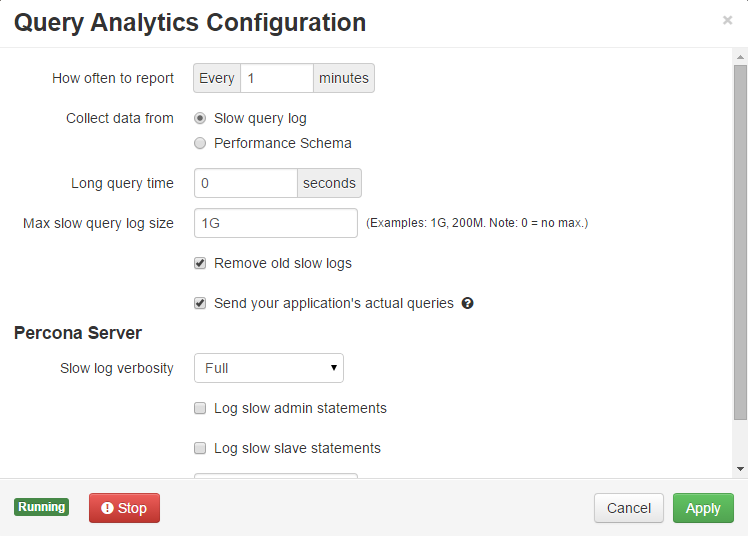
The Query Analytics Configuration dialog enables you to:
- See the status of Percona Agent on the server (running or not)
- Stop the percona-agent service on the server
- Configure how often Percona Agent should report collected query data (be default, query data is reported every minute)
- Select the source of query data:
- Slow query log is the default source of query data.
- Performance Schema is a faster and more efficient alternative for busy servers, available for Percona Server 5.6.9 or newer.
Note
For more information about the advantages and disadvantages of Performance Schema over the slow query log, see Performance Schema.
If you select to use Performance Schema,
you truncate the performance_schema.events_statements_summary_by_digest
table once when Query Analytics starts.
This ensures that there is no invalid SQL code left by third-party tools,
which may not be properly handled by Percona Agent.
The following settings are available for the slow query log:
- Long query time
Queries that take more than the specified time in seconds to execute are added to the slow query log. By default, it is set to 0, meaning that all queries are logged.
It is not recommended to use this setting for reducing the amount of queries logged on a busy server, because the most load is produced by quick queries executed millions of times. If you only log queries that are longer than most, the workload presented by PCT will greatly differ from the actual.
Instead, if you want to reduce overhead, use query sampling available in Percona Server 5.5.34 or newer. Sampling is enabled using the
log_slow_rate_limitparameter, which defines the fraction of queries to log. This parameter can be set using the Log slow rate limit option in the Query Analytics Configuration dialog, as described in Query Analytics for Percona Server.- Max slow query log size
When the slow query log reaches the specified size in bytes, a new one is created. You can add a letter to the value:
- K for kilobytes
- M for megabytes
- G for gigabytes
By default, it is set to 1G, meaning that the maximum allowed size for the slow query log is one gigabyte.
If you set it to 0, the log will grow indefinitely.
- Remove old slow logs
- Disable this option if you want to keep old logs. By default, old slow query logs are replaced by new ones when they reach maximum size.
- Send your application’s actual queries
- Disable this option if you want to send only fingerprints of queries. This can be useful if you use MySQL to store sensitive data. By default, Percona Agent collects and reports full queries with literal values.
Query Analytics for Percona Server
If you are running Percona Server, there are additional options that enable you to configure the granularity of the slow query log. Use these options to:
Select the verbosity of the log:
Minimal: Log only queries with microsecond precision Standard: Log queries with microsecond precision and InnoDB statistics Full: Log all queries. This is selected by default. Enable logging of slow admin statements and slow slave statements
Select the fraction of queries to log. By default, the
log_slow_rate_limitis set to 0, meaning that every query will be logged (same as setting it to 1).If you set it to 20, then 5% of queries will be logged (that is, every 20th query).
Agent Configuration
The Agent tab contains information about all Percona Agents in your PCT infrastructure.
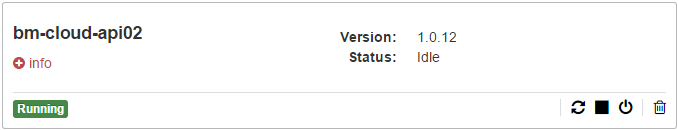
Each panel enables you to:
- See the version and status of the agent
- Remotely control the agent as follows:
- Restart agent service
- Stop agent service
- Abort agent service
- Delete agent
- Expand agent details using the info link.
Agent Details
The Details tab under info contains the agent instance UUID, version number, hostname, and real-time status information. There is status information available about every part of the agent.
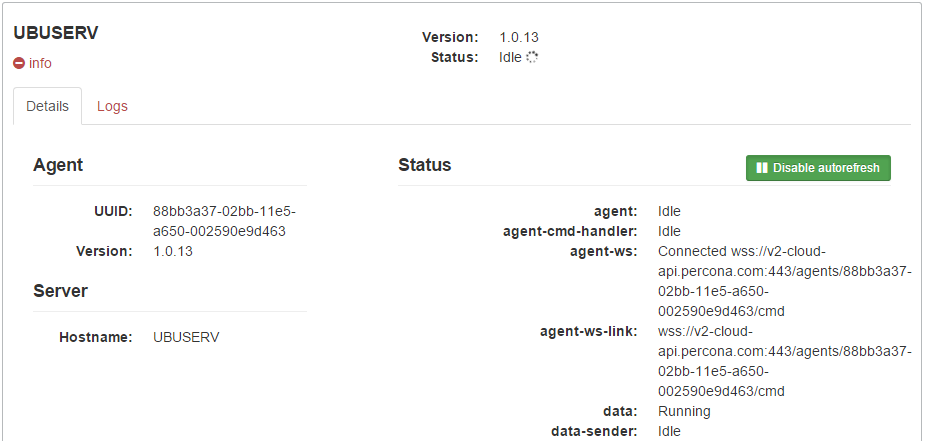
By default, status is requested and updated every 5 seconds. To disable status updates, click Disable autorefresh.
Agent Logs
The Logs tab under info contains messages logged by the agent.
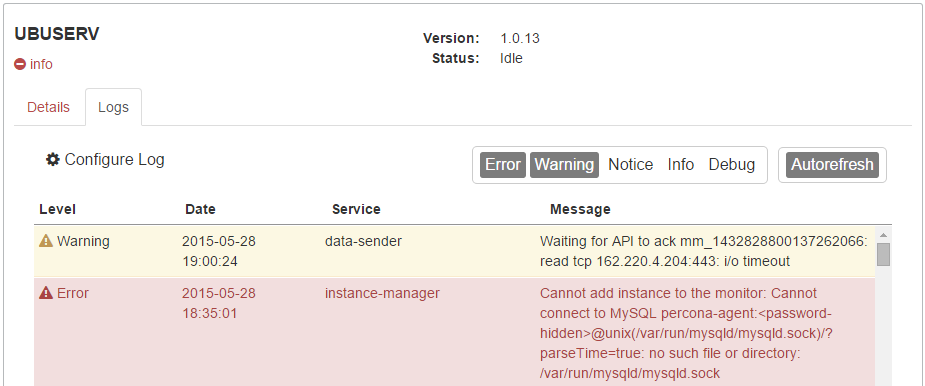
You can filter logged messages down by the required level of importance:
| Error: | Messages about events that are fatal to an operation |
|---|---|
| Warning: | Messages about events that can lead to unexpected behavior, or cause an error if no action is taken |
| Notice: | Messages about unusual events |
| Info: | Messages about normal operational events |
| Debug: | Messages useful for developers who want to debug Percona Agent |
To disable updates of the log, click Autorefresh.
To configure log settings, click Configure Log.
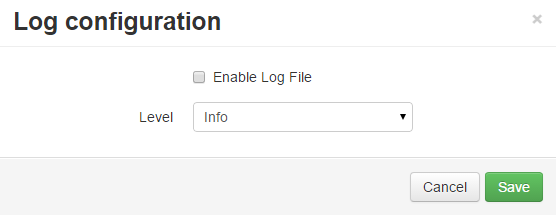
By default, Percona Agent sends log messages to PCT, rather than saving them locally. This enables any user in your organization to view log messages, even if they do not have access to the server where Percona Agent is running.
However, there is a local log file used by Percona Agent:
/usr/local/percona/percona-agent/percona-agent.log
To enable logging to this file, select Enable Log File.
The Level drop-down list defines how detailed you would like the log file to be. For example, selecting Info will include Error, Warning, Notice, and Info message types.
Installation Information
The Install tab contains information required for installing Percona Agent. For example, you can copy the API key to use with the local install script. Or copy the full command to run an automated installation of the latest version.
For more information about how to install Percona Agent, see the Percona Agent section.
Reports Configuration
The Reports tab contains settings for receiving regular reports by email from PCT. These reports contain a digest of critical performance data for your MySQL instances.
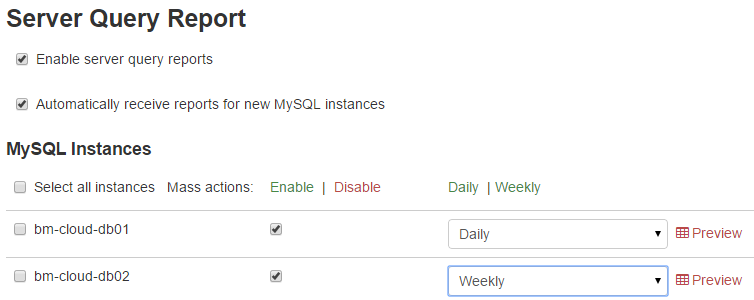
To enable reports, select Enable server query reports. If you want weekly reports to be enabled for new MySQL instances that you add, select Automatically receive reports for new MySQL instances.
You can select MySQL instances for which to enable reports. To keep email clutter to a minimum, disable reports for servers that are not critical, enable weekly reports for more important servers, and enable daily email reports only for the most active servers where you expect frequent changes and high loads.