Web Interface
PCT is a hosted web application for analyzing MySQL performance. Use any browser to see your whole infrastructure, manage it, configure, and analyze collected data to improve performance.
The web appliation is located at cloud.percona.com
Toolbar
The top part of the web UI contains various menus in the toolbar, while the bottom part is reserved for displaying data.

The User menu enables you to manage your PCT Account, switch to another one, or log out.
The Organization menu enables you to select the organization that you want to monitor. All organizations, where the current user is present, are listed in the drop-down list.
The Time Range menu enables you to select the time range for monitoring. Only data collected during the selected time range will be available. You can choose one of the predefined options (last hour, day, month, three months, year) or select a custom range.
The Host menu enables you to select the host that you want to monitor.
The toolbar contains the following tabs:
Performance: Access the dashboard with a status summary for all hosts in your infrastructure. Metrics: Access the Metrics Monitor tool. Queries: Access the Query Analytics tool. Configure: Access general PCT settings.
System Info
System Info provides information about the status and configuration of the server and MySQL instance. The report is generated by Percona Agent using the pt-summary and pt-mysql-summary tools available in Percona Toolkit.
To enable System Info:
- Install or update Percona Agent to version 1.0.7 or later.
- Install Percona Toolkit.
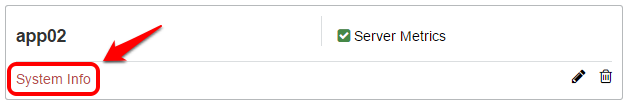
To access the System Info report, click the System Info link in any server or MySQL instance box in the web UI.
The report is separated into sections that cover various aspects, such as processor and memory details for server instances, and table cache and schema details for MySQL instances. You can copy the whole report or sections of it to the clipboard, and then paste it into an e-mail without losing the formatting.
For a complete reference of data provided by System Info, see the documentation for the corresponding tool: pt-summary and pt-mysql-summary.