Performance
The Performance tab provides quick reference dashboards with information for all servers in the selected organization. It contains only the minimum amount of the most critical information. You can use it for routine checks to make sure that nothing unexpected happened in your infrastructure. If you see a problem, there are links to the Query Analytics and Metrics Monitor tools that enable you to drill down into the root cause.
The following screenshot shows an example of the Performance dashboard for a server named trusty.
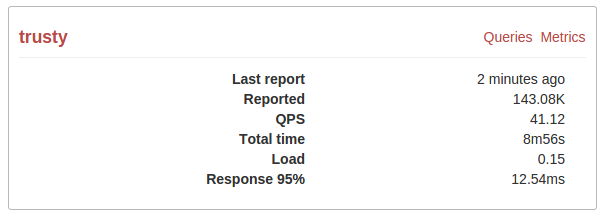
The Performance dashboard provides the following information:
| Last report: | When was the last performance report received |
|---|---|
| Reported: | Total size of performance reports received |
| QPS: | Average number of queries per second |
| Total time: | Total time of all executed queries |
| Load: | Query load calculated as a ratio of total execution time to the actual time. |
| Response 95%: | Response time for the majority of users (that is, 95% of users get a response from the server within the specified time) |
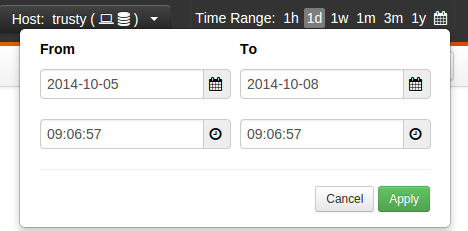
To select the reporting period, use the Time Range menu in the right part of the toolbar. You can select a predefined time range or click the calendar icon to define a custom period.